Prometheus and Grafana Set up


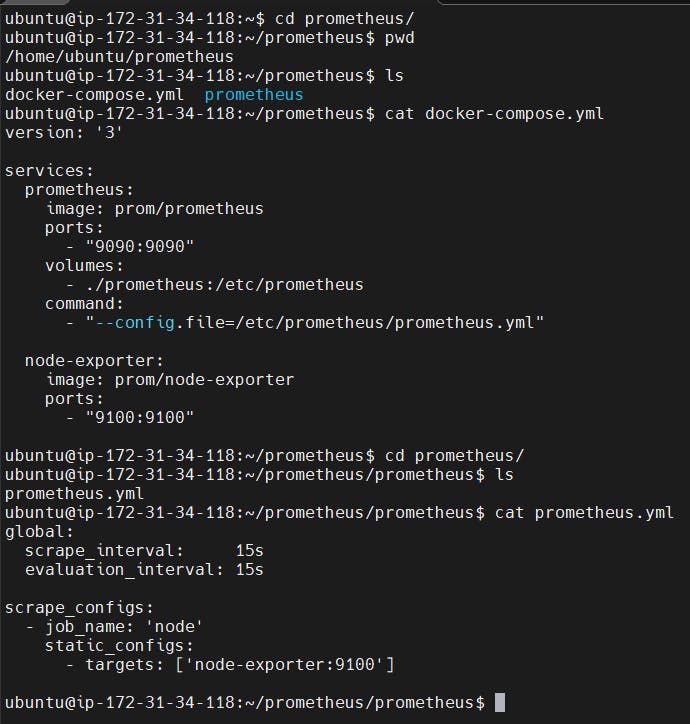
version: '3'

services:
  prometheus:
    image: prom/prometheus
    ports:
      - "9090:9090"
    volumes:
      - ./prometheus:/etc/prometheus
    command:
      - "--config.file=/etc/prometheus/prometheus.yml"

  node-exporter:
    image: prom/node-exporter
    ports:
      - "9100:9100"
global:
  scrape_interval:     15s
  evaluation_interval: 15s

scrape_configs:
  - job_name: 'node'
    static_configs:
      - targets: ['node-exporter:9100']
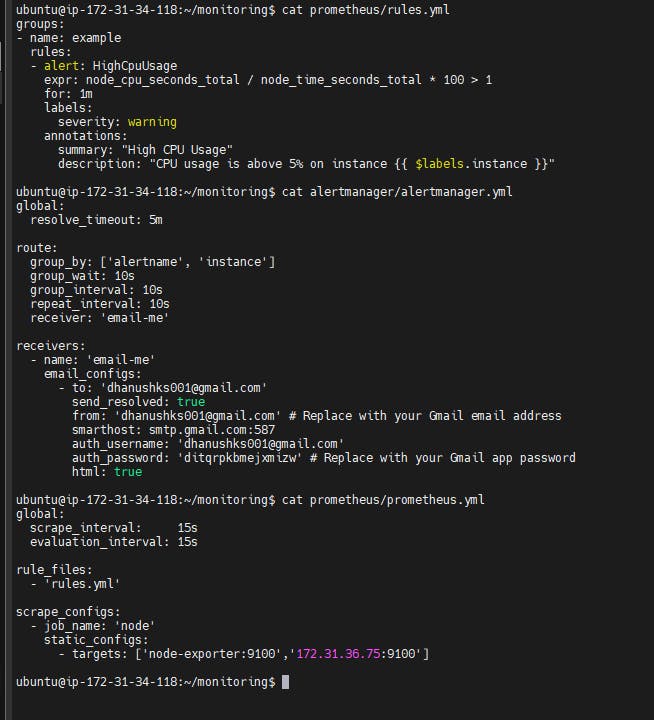
The above is prometheus.yml
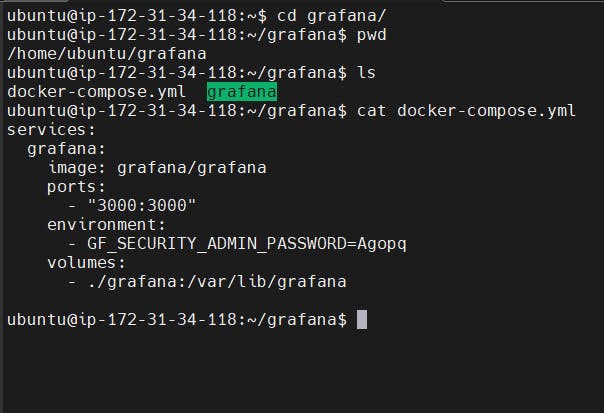
services:
  grafana:
    image: grafana/grafana
    ports:
      - "3000:3000"
    environment:
      - GF_SECURITY_ADMIN_PASSWORD=Agopq
    volumes:
      - ./grafana:/var/lib/grafana
The above is docker-compose for grafana.
you can have entire Monotiring in single docker-compose.yml
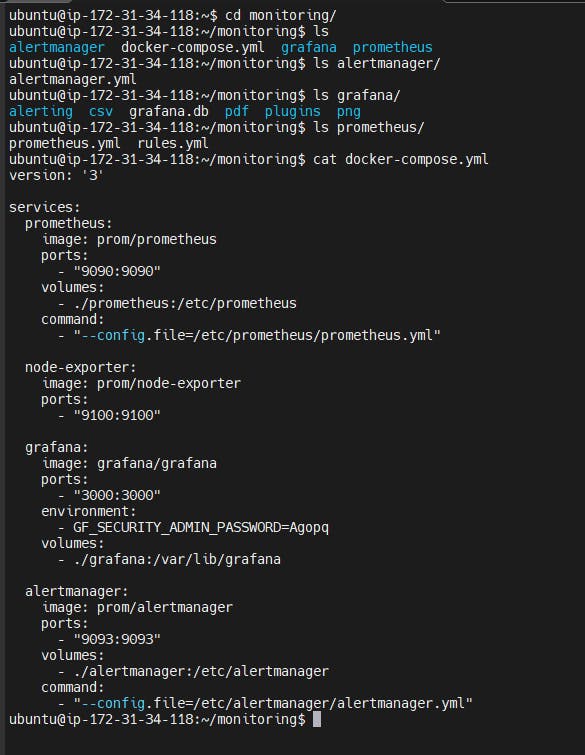
version: '3'

services:
  prometheus:
    image: prom/prometheus
    ports:
      - "9090:9090"
    volumes:
      - ./prometheus:/etc/prometheus
    command:
      - "--config.file=/etc/prometheus/prometheus.yml"

  node-exporter:
    image: prom/node-exporter
    ports:
      - "9100:9100"

  grafana:
    image: grafana/grafana
    ports:
      - "3000:3000"
    environment:
      - GF_SECURITY_ADMIN_PASSWORD=Agopq
    volumes:
      - ./grafana:/var/lib/grafana

  alertmanager:
    image: prom/alertmanager
    ports:
      - "9093:9093"
    volumes:
      - ./alertmanager:/etc/alertmanager
    command:
      - "--config.file=/etc/alertmanager/alertmanager.yml"